How to Create a Social Media Report in 2023?
- May 7, 2023
- Knowledge Base
- 0 Comments

Do you want to track your social media performance?
It can be a daunting task for a social media manager as each platform has its set of metrics and analytics tools, making it challenging to keep track of performance across all platforms and share the results with the stakeholders.
But by using in-depth social media reports, you can simplify the process and ensure regular tracking, analysis, and sharing of your performance.
So, how can you create a social media performance report?
Is there any social media reporting template available?
This article will provide detailed information on a social media report and how to create one for your business.
You may also wonder: Is there any social media reporting template available? Yes, you can download our free social media report template to quickly create visually appealing, easy-to-understand reports.
Without further ado, let’s dive into the nitty-gritty aspects.
What Is a Social Media Report?
Social media report is a document that summarizes a business or organization’s social media performance over a particular period.
The purpose of a social media performance report is to share insights into the effectiveness of your social media campaigns, identify areas of improvement, and make data-driven decisions to optimize your strategy.
You may require multiple reports to suit different goals or audiences.
For example, the social media audit report evaluates the organization’s overall social media presence and performance, whereas the campaign report measures the success of a specific social media campaign.
The format and content of the report may vary depending on the specific goals and objectives of the organization. It includes visualizations, such as graphs, charts, and tables, to make the data more accessible and easily understood.
You can prepare social media reports regularly, such as weekly, monthly, or quarterly, depending on the needs of the business.
Importance of Creating Social Media Reports
Social media reports provide a comprehensive overview of a business’s social media performance. It can help you understand the current trajectory of your marketing strategies and help you optimize accordingly.
Here’s why creating social media reports is important:
1. Performance measurement
It allows you to track key metrics, such as engagement rates, reach, impressions, clicks, and conversions. This data helps you to understand how your social media efforts are performing, identify trends, and make informed decisions to improve your strategy.
2. Demonstrate ROI
Social media reports help show the ROI of your social media efforts.
It can present data on how your social media activity has impacted your business goals, such as website traffic, leads, sales, and customer retention.
3. Get strategy insights
Social media reports provide insights into what is working and isn’t working with your social media strategy. By analyzing the data, you can evaluate your social media tactics, identify areas for improvement, and adjust your approach accordingly.
4. Monitor competition
Using social media reports is not limited to your performance tracking. You can also track your competitors’ social media activity and performance.
By comparing your metrics against your competitors, you can identify areas where you need to improve and develop new strategies to stay ahead of the competition.
5. Analyze social media trends
You can use reports to plan for the future. Social media performance reports can be used to extract insights into social media trends and changes in audience behavior.
Using the data, you can develop new strategies aligned with your business goals and take advantage of new opportunities to engage with your audience.
But to avail these benefits of social media reports, you must know how to create a detailed report that’s easy to understand and analyze.
Detailed Steps to Create a Social Media Report
Creating a social media report might get complex if you are unaware of the sequential steps. Here are the detailed steps to streamline your process:
Step 1: Define Your Social Media Goals
Before creating a dedicated social media performance report, you must define different objectives and KPIs to make the reporting process.
Goals and objectives provide a benchmark for measuring the success of your social media campaigns. By tracking your progress against your goals, you can determine whether your campaigns are on track or need improvement.
Establish Goals for Social Media Campaigns

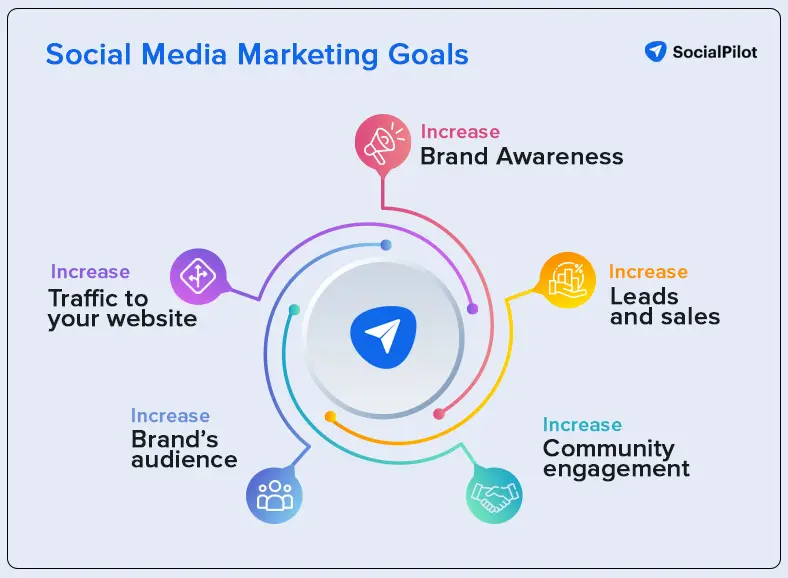
Defining clear goals will help you measure the success of your social media campaigns, so you must define the objectives of your social media campaigns.
These could include increasing brand awareness, generating leads, driving website traffic, boosting sales, etc.
Primarily focus on creating goals that are Specific, Measurable, Achievable, Relevant, and Time-bound (S.M.A.R.T). SMART goals can provide a clear direction and deadline for your social media efforts.
For example, through Instagram, you can set a SMART goal for your social media campaign to increase website traffic by 25% within the next three months.
The goal defines a specific objective of increasing the website traffic and has a quantifiable metric of a 25% rise. It can be achieved because it’s not too ambitious or unrealistic and is relevant because it aligns with the overall marketing strategy.
Also, it has a specific three-month deadline, making it time-bound. But there’s also another aspect of SMART goals which is choosing a specific social media platform.
Choosing Social Media Platforms
You can choose the social media platforms if you know your target audience and which platforms they are most active on.
For example, if your target audience is primarily young adults, platforms like Instagram and Snapchat may be more effective, whereas if your target audience is professionals, platforms like LinkedIn and Twitter may be more appropriate.
Once you have identified the social media platforms that you will use, you can then determine the KPIs that are most relevant to those platforms.
Identify key Performance Indicators (KPIs)
Once you have established your social media campaign goals, you must identify the key performance indicators (KPIs) that will help you measure progress toward these goals.
Your KPIs can include metrics, such as engagement, reach, impressions, clicks, conversions, and audience demographics.
For example, on Instagram, track metrics like engagement rate, follower growth, and reach, whereas, on LinkedIn, focus on metrics like engagement rate, click-through rate, and lead generation.
Step 2: Search Your metric
Once you have identified your KPIs, you must determine the metrics you must track. It can set up the foundation for creating an accurate and detailed social media report.
Choose Appropriate Metrics for KPIs
You need to choose the most appropriate metrics to measure and track them. For example, if your KPI is engagement, you may measure likes, comments, and shares.
Here are some tips for selecting the most relevant metrics for your organization or client:
- Align metrics with business goals.
- Focus on metrics that can be influenced through your social media efforts. For example, if you can’t control the number of followers you have, then measuring follower growth may not be the most useful metric.
- Use a mix of quantitative (likes and comments) and qualitative metrics (sentiment analysis.)
- Consider metrics specific to each platform.
Identify Sources of Data to Measure and Track Metrics
Next, figure out where you’ll be getting all the information that you need to create a comprehensive report.
Identifying the sources of data will provide insights for your social media report. You can extract data from social media platforms, third-party analytics platforms, website analytics, customer relationship management (CRM) tools, and other sources.
Whatever you choose, make sure it provides the insights you need to create a killer social media report!
It can be nerve-wracking to create social media report for multiple clients. To ease your tracking and reporting process, you can rely on SocialPilot.
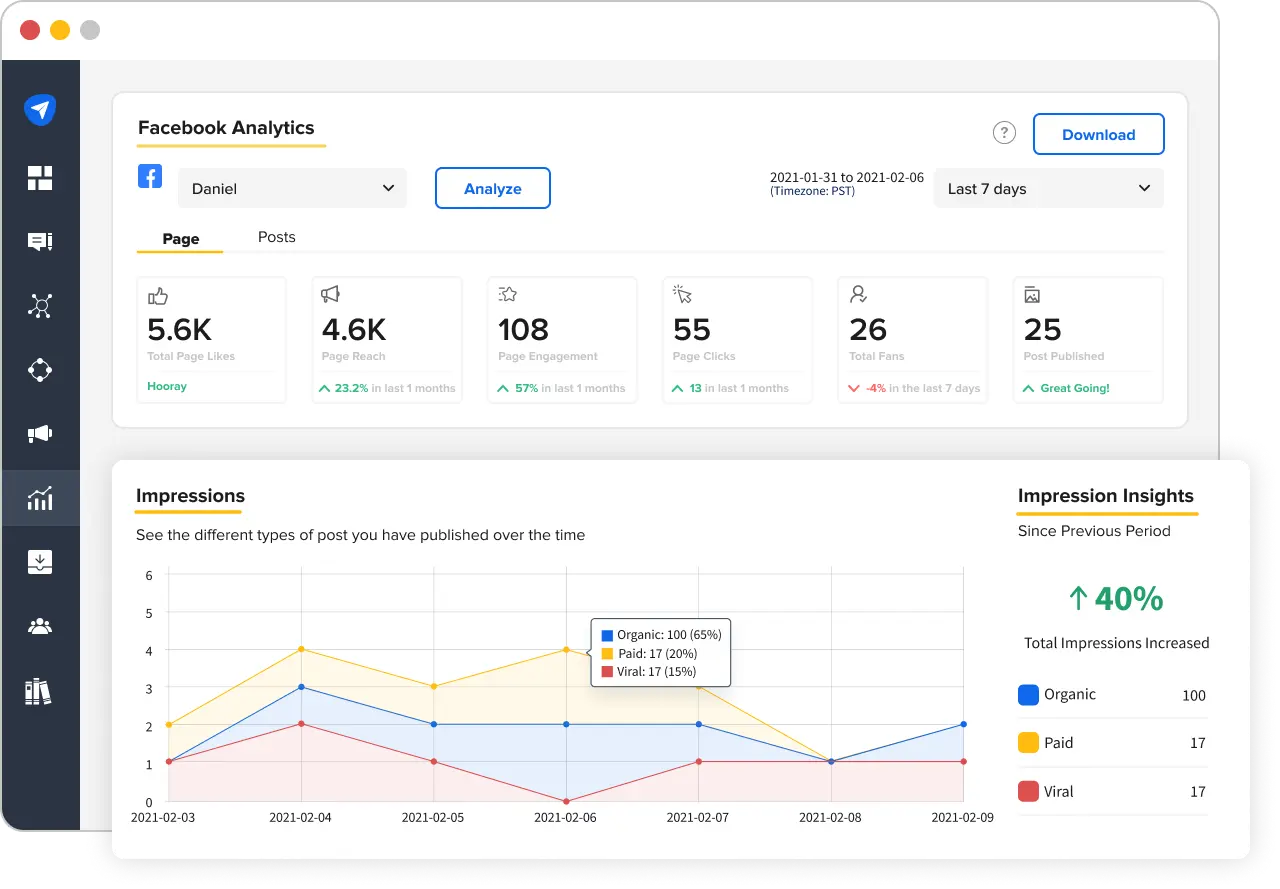
Its powerful social media reporting dashboard can help you with tracking all engagement metrics. You can get detailed analytics of every social media channel on a single page, with the option of exporting visually appealing PDF reports.

Step 3: Create the Template
This step involves creating a template for your social media report. You can choose a pre-existing template or create a custom one tailored to your needs.
Many social media report templates are available, each with benefits and features. Some popular templates include Excel spreadsheets, Google Sheets, PowerPoint presentations, and online dashboard tools.
We’ve created a social media report template for you so that you can create visually pleasing, easy-to-comprehend reports in a quick and effective manner.
But You can also avoid the troubles of manually adding the metrics and maintaining the data once you choose SocialPilot’s social media analytics.
Within a few clicks, you can generate a dedicated social media report based on the analytics results on platforms like Facebook, Instagram, Twitter, LinkedIn, and Google Business Profile.
Step 4: Build the Report
In this step organize the data into a clear and concise format that is easy to understand.
This could include using charts, graphs, and tables to help visualize the data.
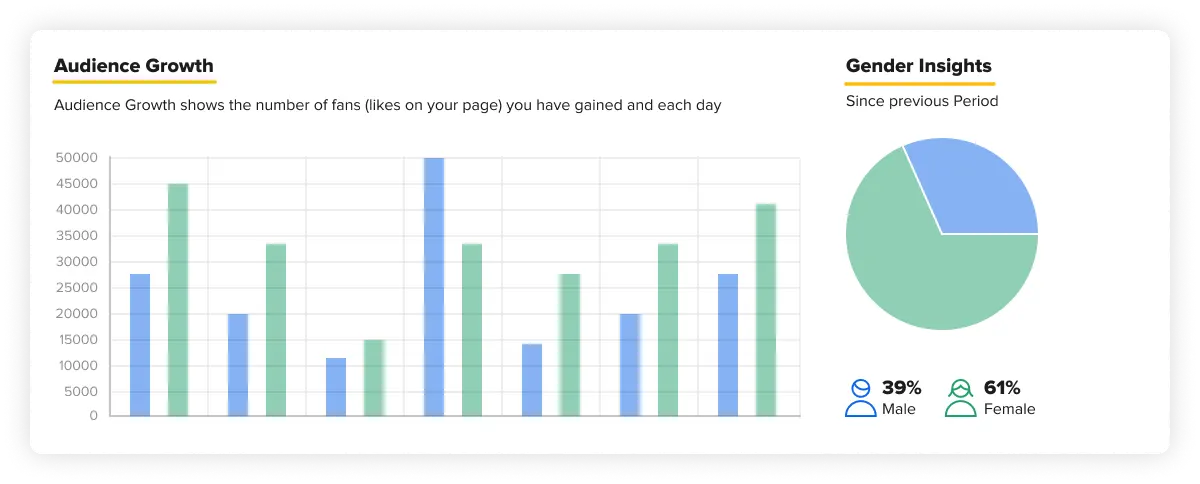
For example, if you want to analyze your Facebook marketing strategy, you must measure your Facebook page’s performance by defining the metrics like the growth of your fans/audience, likes, comments, shares, impressions, etc.
Once the data is available, you can format it into the desired visual graph, making it easier for a non-technical person to understand the reporting results.
If you use SocialPilot’s analytics tool, you can bypass the hassle of creating visually appealing graphics, as the tool already breakdown the most important metrics in the form of eye-pleasing graphs and charts.

Step 5: Analyze and Interpret Data
This step involves interpreting the data to draw insights and identify areas of strength and weakness. Based on your findings, make recommendations that will help you improve your social media strategy.
Interpret Data to Draw Insights
You need to interpret the data to draw insights about your social media performance. Look for trends, patterns, and anomalies in the data to help you understand what works and what doesn’t.
For example, if your audience engages more with videos than images, incorporate more video content into your social media strategy.
Also, if you notice a spike in follower growth after running a specific social media campaign, replicate the same campaign in the future.
Identify Areas of Strength and Weakness
Based on your analysis, identify the areas of strength and weakness in your social media strategy. This will help you make informed decisions about how to improve your performance.
You can use a SWOT analysis to identify areas of strength and weakness in your social media strategy. The framework can identify areas of strength and weakness in your social media strategy and help you leverage the information to make data-driven decisions.
Let’s understand SWOT analysis with an example of a fashion brand with a decent social media presence.
Strengths: The strengths can include a visually appealing Instagram feed, decent social media engagement, and a loyal following of fashion enthusiasts
Weaknesses: You can struggle to generate leads or sales through social media.
Opportunities: To improve its weakness, you can partner with fashion influencers to reach a wider audience or use social media platforms like TikTok to showcase its products and reach a younger demographic.
Threats: If your competitors use social media more effectively, they may attract more customers and gain market share. Also, consistent social media algorithms or policy changes can affect the visibility of your content.
Make Final Recommendations Based on Findings
Based on your insights, make recommendations for how to improve your social media strategy. These recommendations should be actionable and tied to your social media campaign goals.
For example, if your social media engagement rates are declining on Instagram, you can improve your engagement rates by focusing on creating more interactive content that encourages user participation.
Try out different social media campaigns like polls, Q&A sessions, or quizzes or share user-generated content, which can drive better engagement from the audience.
Also, blending your content strategy with new formats like Instagram Reels can deliver excellent results.
Step 6: Report and share
This step involves presenting your report clearly and concisely and sharing it with the relevant stakeholders. You should also prepare for future reports by tracking your progress and making necessary adjustments to your social media strategy.
How to Present the Report
You need to decide how to present your social media report clearly and easily to understand, helping communicate your findings.
Choosing a detailed Google Sheets format with multiple visual elements can make it easier for the stakeholders and your team members to analyze the social media reports.
You can use our ready-to-download template to create your social media report presentation. It will save you loads of time and allow you to create attractive, easy-to-comprehend reports.
Best Practices for Reporting and Sharing
There are several best practices you should follow when reporting and sharing your social media report. These include tailoring your report to your audience, highlighting key insights and recommendations, and being transparent about the data and method used.
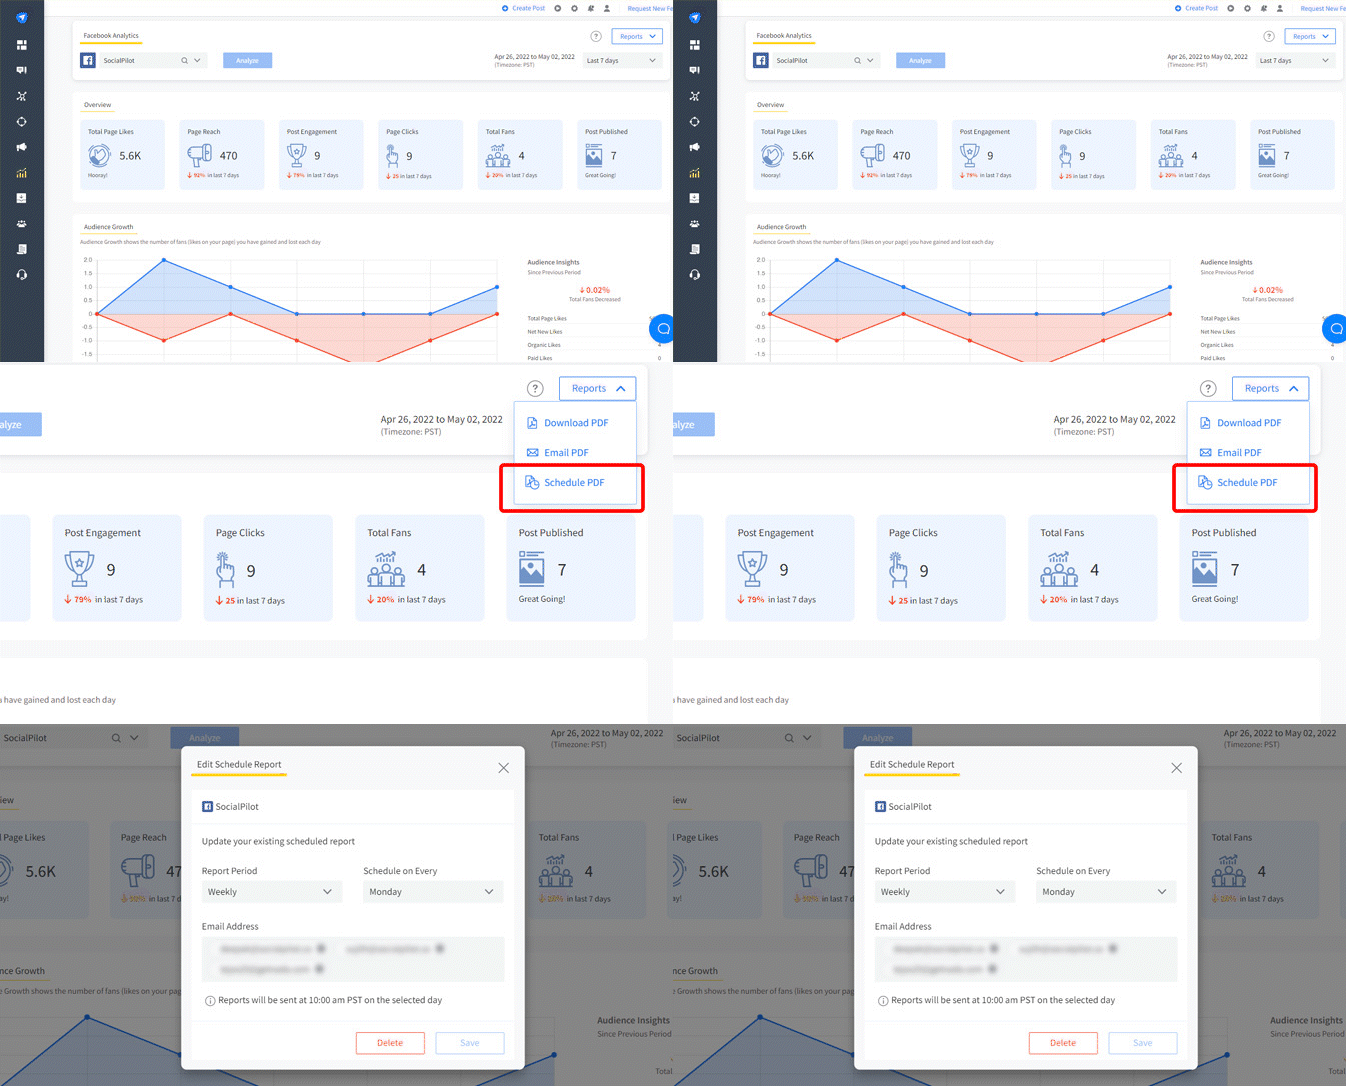
Also, understand that report sharing is not a one-time thing. Many marketers do it every week, and others do it every month. So, with SocialPilot, we removed the manual task of sharing reports from your workflow with our dedicated Schedule Report feature.
With a click of a button, you can automate weekly or monthly sharing of your in-depth analytics report with teammates and clients via email. Say goodbye to the hiccups of generating social media reports manually monthly.

Preparing for Future Reports
It’s important to prepare for future reports by documenting your process and method. This will help you maintain consistency across different reports and make it easier to track your progress.
You should also identify areas for improvement and set goals for future social media campaigns.
Using the detailed steps, you can create a well-polished social media report to help you improve your strategies and optimize your resources.
Ready, Get Set, Report!
A social media report template can be your north star to guide you through your social media performance analytics, which otherwise would feel unorganized, confusing, and resultless. To help you save time, we have created a free social media reporting template for you to download.
You can also create an excellent social media report template by performing all the detailed steps in this blog.
However, your task will not be finished once the template is created.
You must face multiple challenges to extract and manage social media data. But with SocialPilot’s powerful social media reporting dashboard, you can avoid the hassle of creating a report template from scratch and create perfectly-crafted social media reports quickly.
Here’s what you’ll get:
- Content performance: Easily understand your top-performing content that engages your audience and leverage it to scale your social media performance.
- Audience insights: Know your audience better and analyze growth patterns to create social engagement strategies using SocialPilot’s integrated social media insight tool.
- Identify your biggest fans: Discover who interacts with your social posts, the most with impactful insights, like most active commenter, sharer, and more.
- Best time to post: Analyze the best time to post by getting insights about the active audience during the week.
- Comprehensive analytics: View analytics of all your social posts irrespective of whether you posted from SocialPIlot.
- Share PDF analytics reports: Schedule your in-depth PDF reports to share automatically via email with colleagues and clients, or download them from the Analytics tab.
Try it yourself!
Kickstart the free trial or schedule a demo call.


