The Ultimate Guide to Google Search Console in 2023
- December 8, 2023
- Knowledge Base
- 0 Comments

At any given time, I have GSC open in 2 to 10 tabs. It’s helpful on a macro and micro level — both when I need to see how many impressions HubSpot is gaining month over month or figure out what’s happened to a high-traffic blog post that suddenly fell.
I’m a content strategist on HubSpot’s SEO team, which means GSC is particularly useful to me. But anyone who’s got a website can and should dip their toes in these waters. According to Google, whether you’re a business owner, SEO specialist, marketer, site administrator, web developer, or app creator, Search Console will come in handy.
I remember the first time I opened GSC — and it was overwhelming. There were tons of labels I didn’t understand (index coverage?!?), hidden filters, and confusing graphs. Of course, the more I used it, the less confusing it became.
But if you want to skip the learning curve (and why wouldn’t you), good news: I’m going to reveal everything I’ve learned about how to use Google Search Console like a pro.
This guide covers:
What is Google Search Console?
Google Search Console (formerly Google Webmaster Tools) is a free platform for anyone with a website to monitor how Google views their site and optimize its organic presence. That includes viewing your referring domains, mobile site performance, rich search results, and highest-traffic queries and pages.
First things first. If you haven’t already signed up for GSC, it’s time to do so.
How to Add Your Website to Google Search Console
- Sign into your Google account. Make sure you’re using your business (not personal) account if it’s a business website.
- Go to Google Webmaster Tools.
- Click “Add a property.”
- Choose “Website” from the drop-down menu and enter the URL of your site. Make sure you’re using the exact URL that appears in the browser bar.
- Click “Continue.”
- Pick a way to verify you own your website (HTML file upload, domain name provider, HTML tag, GA tracking code, or GTM container snippet).
- If your site supports both http:// and https://, add both as separate sites. You must also add each domain (for example, hubspot.com, blog.hubspot.com, and www.hubspot.com).
Google starts tracking data for your property as soon as you add it to GSC — even before it’s verified you’re the site owner.
Verifying Your Site on GSC
Because GSC gives you access to confidential information about a site or app’s performance (plus influence over how Google crawls that site or app!), you have to verify you own that site or app first.
Verification gives a specific user control over a specific property. You must have at least one verified owner per GSC property.
Also, note that verifying your property doesn’t affect PageRank or its performance in Google search. Of course, you can use GSC data to strategize how to rank higher — but simply adding your website to GSC won’t automatically make your rankings go up.
GSC Verification Methods
- HTML file upload: Upload a verification HTML file to a specific location of your website.
- Domain name provider: Sign into your domain registrar (like GoDaddy, eNom, or networksolutions.com), and verify your site directly from GSC or add a DNS TXT or CNAME record.
- HTML tag: Add a <meta> tag to the <HEAD> section of a specific page’s HTML code.
- Google Analytics tracking code: Copy the GA tracking code that you use on your site. (You need “edit” permission in GA for this option.)
- Google Tag Manager container snippet code: Copy the GTM container snippet code associated with your site. (You need View, Edit, and Manage container-level permissions in GTM for this option.)
Google-hosted sites, including Blogger and Sites pages, are automatically verified.
URL Versions: WWW Domain or Not?
True or false: hubspot.com and www.hubspot.com are the same domain.
The answer? False! Each domain represents a different server; those URLs might look very similar, but from a technical perspective, they’re two unique domains.
However, if you type “hubspot.com” into your browser bar, you’ll land at “www.hubspot.com”. What is this sorcery?
HubSpot has chosen “www.hubspot.com” as its preferred, or canonical, domain. That means we’ve told Google we want all of our URLs displayed in search as “www.hubspot.com/……”. And when third parties link to our pages, those URLs should be treated as “www.hubspot.com/……” as well.

If you don’t tell GSC which domain you prefer, Google may treat the www and non-www versions of your domain as separate — splitting all those page views, backlinks, and engagement into two. Not good.
(At this time you should also set up a 301 redirect from your non-preferred domain to your preferred one, if you haven’t already.)
GSC Users, Owners, and Permissions
There are two GSC role-types. I know you might be itching to get to the good stuff (cough the data) but it’s important to do this right.
- Owner: An owner has total control over their properties in GSC. They can add and remove other users, change the settings, see all data, and access every tool. A verified owner has completed the property verification process, while a delegated owner has been added by a verified one. (Delegated owners can add other delegated owners.)
- User: A user can see all data and take some actions, but can’t add new users. Full users can see most data and take some actions, while restricted users can only view most data.
Think carefully about who should have which permissions. Giving everyone full ownership could be disastrous — you don’t want someone to accidentally change an important setting. Try to give your team members just as much authority as they need and no further.
For example, at HubSpot, our technical SEO manager Victor Pan is a verified owner. I’m an SEO content strategist, which means I use GSC heavily but don’t need to change any settings, so I’m a delegated owner. The members of our blogging team, who use GSC to analyze blog and post performance, are full users.
Here are detailed instructions on adding and removing owners and users in Search Console.
There’s a third role: an associate. You can associate a Google Analytics property with a Search Console account — which will let you see GSC data in GA reports. You can also access GA reports in two sections of Search Console: links to your site, and Sitelinks.
A GA property can only be associated with one GSC site, and vice versa. If you’re an owner of the GA property, follow these instructions to associate it with the GSC site.
Do You Need a Sitemap?
A sitemap isn’t necessary to show up in Google search results. As long as your site is organized correctly (meaning pages are logically linked to each other) , Google says its web crawlers will normally find most of your pages.
But there are four situations a sitemap will improve your site’s crawlability:
- It’s really big. The more pages you have, the easier it is for Googlebot to miss any changes or additions.
- It has lots of “isolated” pages. Any page that has few inbound links from other pages is harder for a web crawler to discover.
- It’s new. Newer sites have few backlinks (links from other sites) making them less discoverable.
- It uses rich media content and/or shows up in Google News. In these cases, your sitemap makes it easier for Google to format and display your site in search.
Once you’ve built your sitemap, submit it using the GSC sitemaps tool.
GSC Sitemaps Report
After Google has processed and indexed your sitemap, it will appear in the Sitemaps report. You’ll be able to see when Google last read your sitemap and how many URLs it’s indexed.
GSC Dimensions and Metrics
There are a few terms you should understand before using GSC.
What’s a Google Search Console query?
This is a search term that generated impressions of your site page on a Google SERP. You can only find query data in Search Console, not Google Analytics.
What’s an impression?
Each time a link URL appears in a search result, it generates an impression. The user doesn’t have to scroll down to see your search result for the impression to count.
What’s a click?
When the user selects a link that takes them outside of Google Search, that counts as one click. If the user clicks a link, hits the back button, then clicks the same link again — still one click. If then, they click a different link — that’s two clicks.
When a user clicks a link within Google Search that runs a new query, that’s not counted as a click.
Also, this doesn’t include paid Google results.
What’s average position?
This is the mean ranking of your page(s) for a query or queries. Suppose our guide to SEO tools is ranking #2 for “SEO software” and #4 for “keyword tools.” The average position for this URL would be 3 (assuming we were ranking for literally nothing else).
What’s CTR?
CTR, or click-through rate, is equal to Clicks divided by Impressions, multiplied by 100. If our post shows up in 20 searches, and generates 10 clicks, our CTR would be 50%.
Filtering in Google Search Console
GSC offers several different ways to view and parse your data. These filters are incredibly handy, but they can also be confusing when you’re familiarizing yourself with the tool.
Search Type
There are three search types: web, image, and video. I typically use “web,” since that’s where most of the HubSpot Blog traffic comes from, but if you get a lot of visits from image and/or video search, make sure you adjust this filter accordingly.
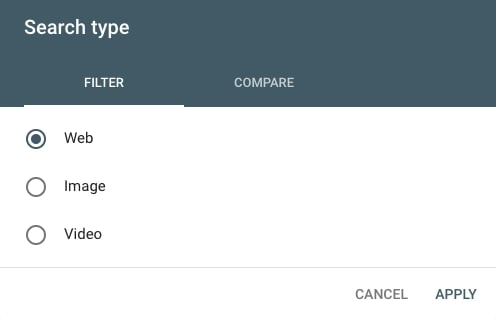
You can also compare two types of traffic. Just click the “Compare” tab, choose the two categories you’re interested in, and select “Apply.”
This can lead to some interesting findings. For example, I discovered this color theory 101 post is getting more impressions from image search than web (although the latter is still generating more clicks!).

Date Range
GSC now offers 16 months of data (up from 90 days). You can choose from a variety of pre-set time periods or set a custom range.
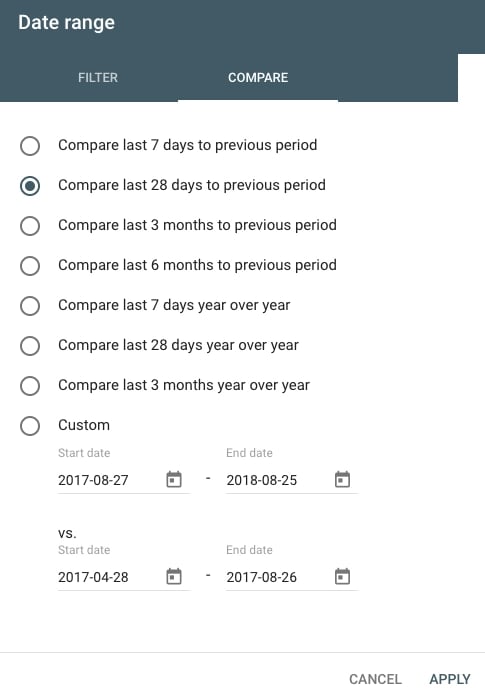
As with search type, you can also compare two date ranges in the “Compare” tab.
Queries, Page, Country, Device, Search Appearance
Click “New” next to the Date filter to add up to five other types of filters: query, page, country, device, and search appearance.

These filters can be layered; for instance, if I wanted to see data for SEO-related queries appearing on mobile search, I’d add a filter for queries containing “SEO” on mobile devices. If I only wanted to limit the results even further to posts on the Marketing Blog, I’d add another filter for Pages containing the URL “blog.hubspot.com/marketing”.
You can get very specific here — I recommend playing around with different combinations of filters so you see what’s possible.
Index Coverage Report
The index coverage report shows you the status of every page Google has tried to index on your site. Using this report, you can diagnose any indexing issues. Each page is assigned one of four statuses:
- Error: The page couldn’t be indexed.
- Warning: The page is indexed but has a problem.
- Excluded: The page is an alternate page with content duplicate with a canonical page. For this reason, it has been purposefully excluded while the canonical page has been found and indexed.
Submitted Sitemaps
In this area, you can make your sitemap available to Google and see its status.
How to Use Google Search Console
- Identify your highest-traffic pages.
- Identify your highest-CTR queries.
- Look at average CTR.
- Monitor your CTR over time.
- Monitor your impressions over time.
- Monitor your average position over time.
- Identify your highest-ranking pages.
- Identify your lowest-ranking pages.
- Identify ranking increases and decreases.
- Identify your highest-traffic queries.
- Compare your site’s search performance across desktop, mobile, and tablet.
- Compare your site’s search performance across different countries.
- Learn how many of your pages have been indexed.
- Learn which pages haven’t been indexed and why.
- Monitor total number of indexed pages and indexing errors.
- Identify mobile usability issues.
- Learn how many total backlinks your site has.
- Identify which URLs have the most backlinks.
- Identify which sites link to you the most.
- Identify the most popular anchor text for external links.
- Identify which pages have the most internal links.
- Learn how many total internal links your site has.
- Find and fix AMP errors.
- See Google how Google views a URL.
Can you see why I love GSC? Let’s dig into each use case.
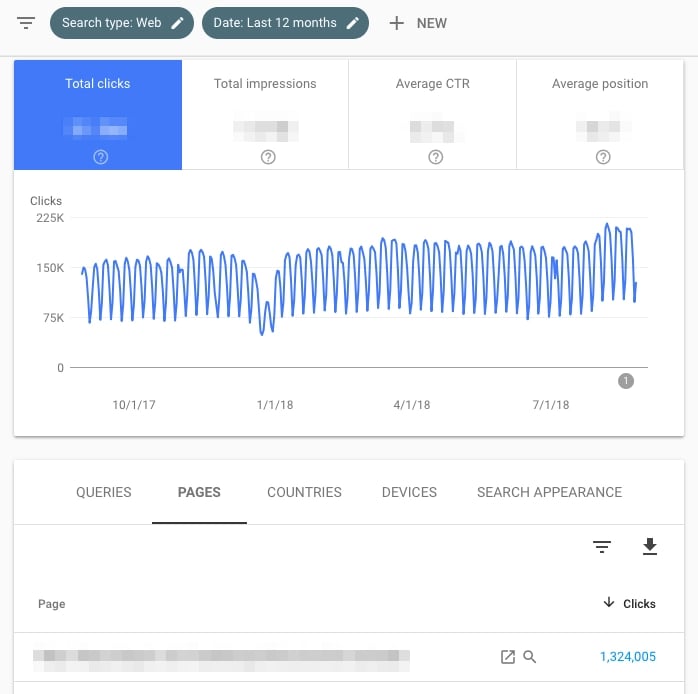
1. Identify your highest-traffic pages.
- Click Performance.
- Click the “Page” tab (next to Queries).
- Change the date range to “Last 12 months”. (A full year gives you a comprehensive overview of your traffic, but feel free to adjust the time period.)
- Make sure “Total clicks” is selected.
- Click the small downward arrow next to “Clicks” to sort from highest to lowest.
2. Identify your highest-CTR queries.
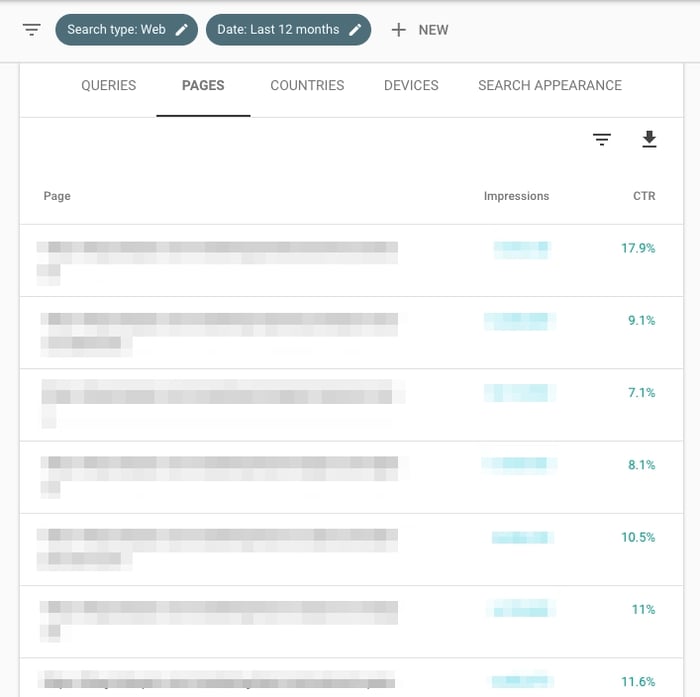
- Click Performance.
- Click the “Queries” tab.
- Change the date range to “Last 12 months”. (A full year gives you a comprehensive overview of your traffic, but feel free to adjust the time period.)
- Make sure “Average CTR” is selected.
- Click the small downward arrow next to “CTR” to sort from highest to lowest.
Note: It’s useful to look at this in tandem with “Impressions” (check “Total impressions” to see this information side-by-side). A page might have high CTR but low impressions, or vice versa — you won’t get the full picture without both data points.
3. Look at average CTR.
- Click Performance.
- Click the date to adjust the time period. Choose whatever range you’re interested in. (Alternatively, click “Compare” to analyze two date ranges at once.)
- Look at “Average CTR”.
- Click Performance.
- Click the date to adjust the time period. Choose whatever range you’re interested in. (Alternatively, click “Compare” to analyze two date ranges at once.)
- Look at “Total impressions”.
- Go to Status > Performance.
- Click the date to adjust the time period. Choose whatever range you’re interested in. (Alternatively, click “Compare” to analyze two date ranges at once.)
- Look at “Average position”.
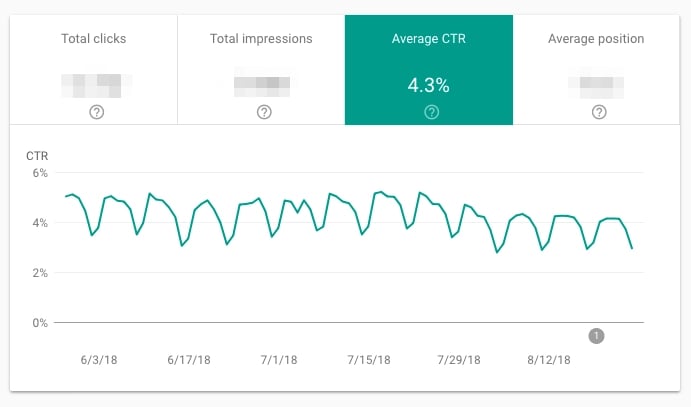
4. Monitor your CTR over time.
I recommend keeping an eye on CTR. Any significant movement is significant: If it’s dropped, but impressions have gone up, you’re simply ranking for more keywords, so average CTR has declined. If CTR has increased, and impressions have decreased, you’ve lost keywords. If both CTR and impressions have gone up, congrats — you’re doing something right!
5. Monitor your impressions over time.
As you create more content and optimize your existing pages, this number should increase. (As always, there are exceptions — maybe you decided to target a small number of high conversion keywords rather than a lot of average conversion ones, are focusing on other channels, etc.)
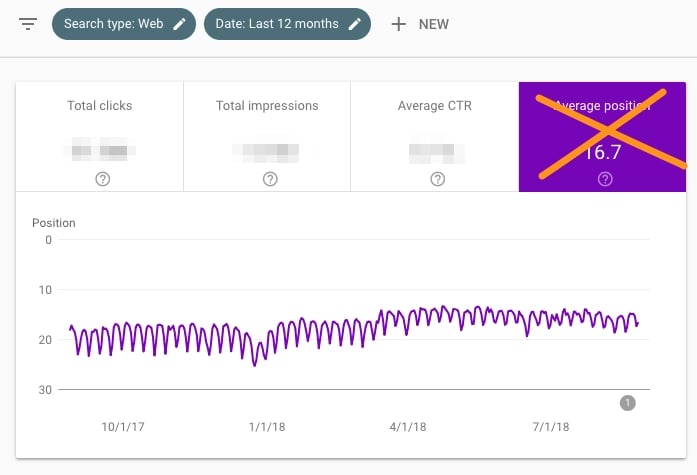
6. Monitor average position over time.
Average position isn’t that useful on a macro level. Most people are concerned when it goes up — but that’s shortsighted. If a page or set of pages starts ranking for additional keywords, average position usually increases; after all, unless you’re ranking for the exact same position or better as your existing keywords, your “average” will get bigger.
Don’t pay too much attention to this metric.
7. Identify your highest-ranking pages.
- Click Performance.
- Click the “Page” tab.
- Change the date range to “Last 28 days.” (You want an up-to-date, accurate snapshot of your pages.)
- Make sure “Average position” is selected.
- Click the small upward arrow next to “Position” to sort from smallest (good) to highest (bad).
- Click Performance.
- Click the “Page” tab.
- Change the date range to “Last 28 days.” (You want an up-to-date, accurate snapshot of your pages.)
- Make sure “Average position” is selected.
- Click the small downward arrow next to “Position” to sort from highest (bad) to lowest (good).
Because you’re looking at average position by URL, that number is the mean of all of that page’s rankings. In other words, if it’s ranking for two keywords, it might be #1 for a high-volume query and #43 for a low-volume one — but the average will still be 22.
With that in mind, don’t judge the success or failure of a page by “average position” alone.
8. Identify your lowest-ranking pages
Follow the same steps that you would to identify your highest-ranking pages, except this time, toggle the small upward arrow next to “Position” to sort from highest (bad) to smallest (good).
9. Identify ranking increases and decreases.
- Click Performance.
- Click the “Query” tab.
- Click “Date range” to change the dates, then choose the “Compare” tab.
- Select two equivalent time periods, then click “Apply.”
At this point, you can look at the data in GSC, or export it. For an in-depth analysis, I highly recommend the second — it’ll make your life much easier.
To do so, click the downward arrow beneath “Search Appearance,” then download it as a CSV file or export it to Google Sheets.
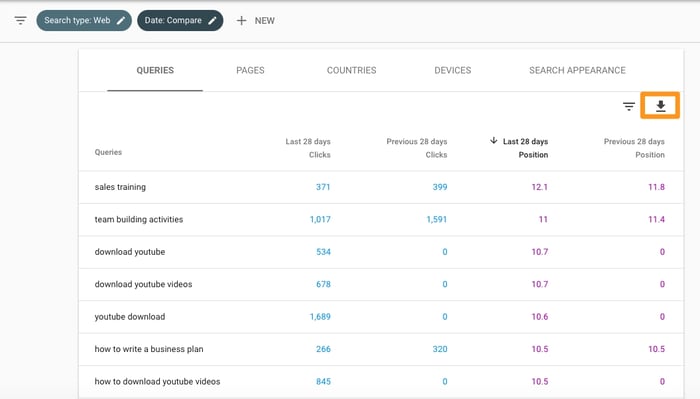
After you have this data in spreadsheet form, you can add a column for the position differences (Last 28 days Position – Previous 28 days Position), then sort by size.
If the difference is positive, your site has moved up for that query. If it’s negative, you’ve dropped.
10. Identify your highest-traffic queries.
- Click Performance.
- Click the “Query” tab.
- Click “Date range” to choose a time period.
- Make sure “Total clicks” is selected.
- Click the small downward arrow next to “Clicks” to sort from highest to lowest.
Knowing which queries bring in the most search traffic is definitely useful. Consider optimizing the ranking pages for conversion, periodically updating them so they maintain their rankings, putting paid promotion behind them, using them to link to lower-ranked (but just as if not more important) relevant pages, and so on.
11. Compare your site’s search performance across desktop, mobile, and tablet.
- Click Performance.
- Go to the “Devices” tab.
- Make sure “Total clicks,” “Total impressions,” “Average CTR,” and “Average Position” are selected.
- Compare your performance across desktop, mobile, and tablet.
12. Compare your site’s search performance across different countries.
- Click Performance.
- Go to the “Countries” tab.
- Make sure “Total clicks,” “Total impressions,” “Average CTR,” and “Average Position” are selected.
- Compare your performance across nations.
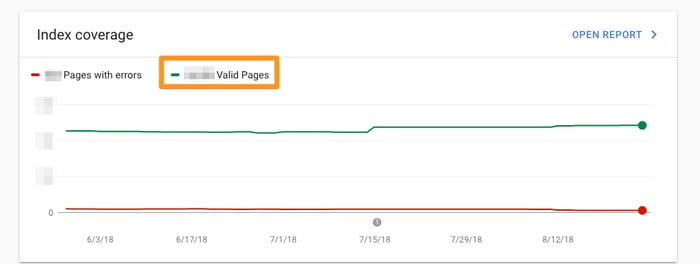
13. Learn how many of your pages have been indexed.
- Start at “Overview.”
- Scroll down to the Index coverage summary.
- Look at the “Valid pages” count.
14. Learn which pages haven’t been indexed and why.
- Go to Overview > Index coverage.
- Scroll down to the Details box to learn which Errors are causing indexing issues and how frequent they are.
- Double-click on any Error type to see the affected page URLs.
15. Monitor total number of indexed pages and indexing errors.
- Go to Overview > Index coverage.
- Make sure “Error”, “Valid with warnings”, “Valid”, and “Excluded” are all selected.
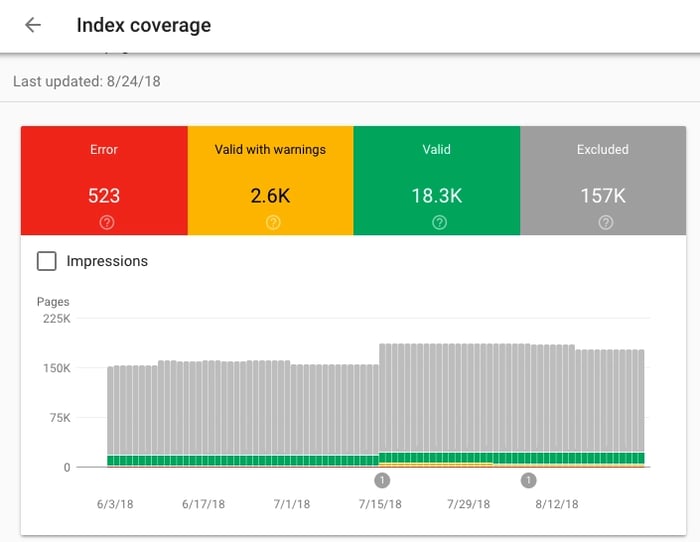
The total number of indexed pages on your site should typically go up over time as you:
- Publish new blog posts, create new landing pages, add additional site pages, etc.
- Fix indexing errors
If indexing errors go up significantly, a change to your site template might be to blame (because a large set of pages have been impacted at once). Alternatively, you may have submitted a sitemap with URLs Google can’t crawl (because of ‘noindex’ directives, robots.txt, password-protected pages, etc.).
If the total number of indexed pages on your site drops without a proportional increase in errors, it’s possible you’re blocking access to existing URLs.
In any case, try to diagnose the issue by looking at your excluded pages and looking for clues.
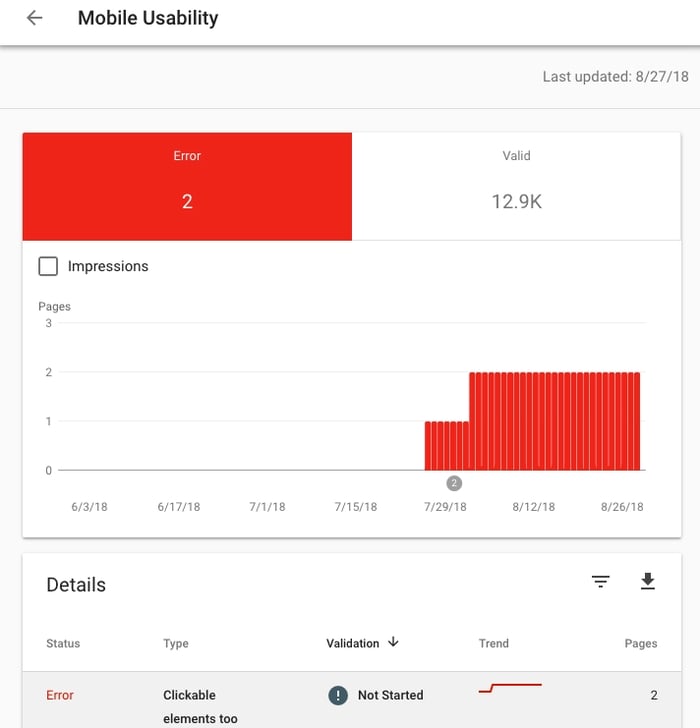
16. Identify mobile usability issues.
- Click Mobile Usability.
- Make sure “Error” is selected.
- Scroll down to the Details box to learn which Errors are causing mobile usability issues and how frequent they are.
- Double-click on any Error type to see the affected page URLs.
17. Learn how many total backlinks your site has.
- Click Links.
- Open the Top linked pages report.
- Look at the box labeled “Total external links.”
- Click the downward arrow next to “Incoming links” to sort from highest to lowest backlinks.
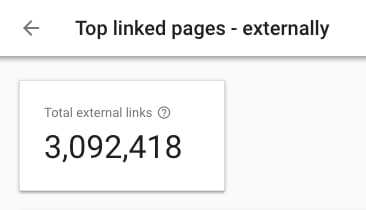
Every backlink is a signal to Google that your content is trustworthy and useful. In general, the more backlinks the better! Of course, quality matters — one link from a high-authority site is much more valuable than two links from low-authority sites. To see which sites are linking to a specific page, simply double-click that URL in the report.
18. Identify which URLs have the most backlinks.
- Click Links.
- Open the Top linked pages report.
- Click the downward arrow next to “Incoming links” to sort from highest to lowest backlinks.
If you want to help a page rank higher, adding a link from a page with a ton of backlinks is a good bet. Those backlinks give that URL a lot of page authority — which it can then pass on to another page on your site with a link.
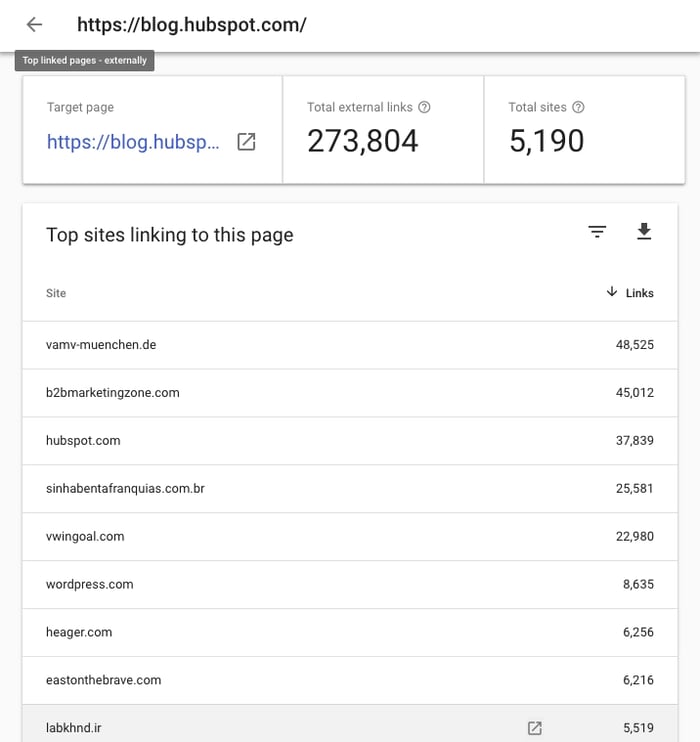
19. Identify which sites link to you the most.
- Click Links.
- Scroll down to “Top linking sites” > “More.”
Knowing your top referring domains is incredibly useful for promotion — I’d recommend starting with these sites whenever you do a link-building campaign. (Just make sure to use a tool like Moz, SEMrush, or Arel=”noopener” target=”_blank” hrefs to filter out the low-authority ones first.)
These may also be good candidates for comarketing campaigns or social media partnerships.
20. Identify the most popular anchor text for external links.
- Click Links.
- Scroll down to “Top linking text” > “More.”
Anchor text should be as descriptive and specific as possible — and best case scenario, include your keyword. If you find websites linking to your pages but using anchor text like “Click here” “Learn more”, “Check it out”, etc., consider sending an email asking them to update the hyperlink.
21. Identify which pages have the most internal links.
- Click Links.
- Scroll down to “Top linked pages” > “More.”
It’s normal for some URLs to have more inbound links. For example, if you run an ecommerce site, every product page in your “Skirts” category will link back to the “Skirts” overview page. That’s a good thing: It tells Google your top-level URLs are the most important (which helps them rank higher).
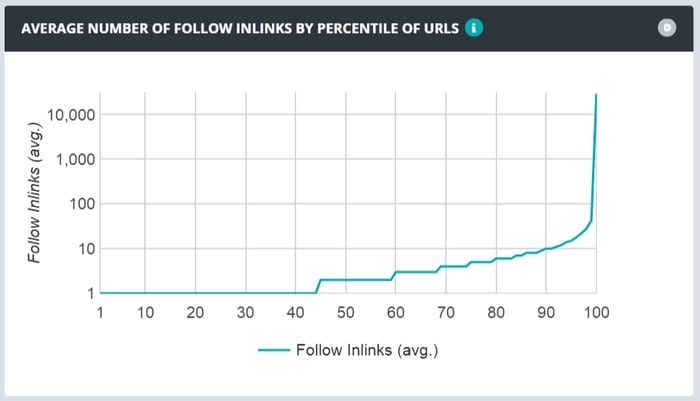
However, a heavily skewed link distribution ratio isn’t ideal. If a tiny percentage of your URLS are getting way more links than the rest, it’ll be difficult for the 95% to receive search traffic — you’re not passing enough authority to them.
Here’s what a heavily skewed distribution looks like:
The optimal spread looks like this:
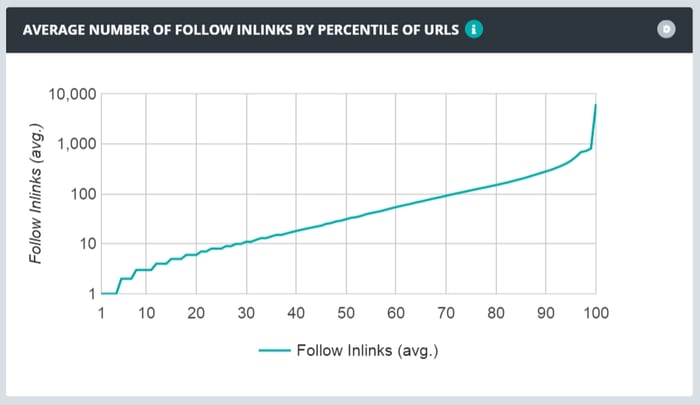
Use GSC’s link data to learn how your links are distributed and if you need to focus on making your link distribution more smooth.
22. Learn how many total internal links your site has.
- Click Links.
- Scroll down to “Top linked pages” > “More.”
- Look at the box labeled “Total internal links.”
23. Find and fix AMP errors.
- Click AMP.
- Make sure “Error” is selected.
- Scroll down to the “Details” box to see which types of issues you have and how frequent they are.
Google recommends fixing errors before looking at the pages in the “Valid with warnings” category. By default, errors are ranked by severity, frequency, and whether you’ve addressed them.
24. See Google how Google views a URL.
- Click the white magnifying glass at the top of the page.
- Enter the page URL. (Make sure it belongs to the property you’re currently viewing.)
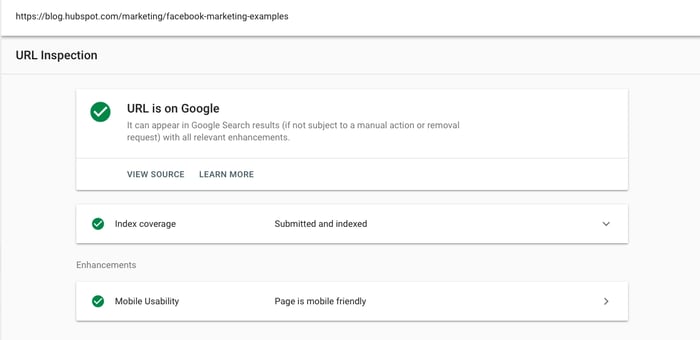
Here’s how to interpret the results. If the URL is on Google, that means it’s indexed and can appear in search.
That doesn’t mean it will — if it’s been marked as spam or you’ve removed or temporarily blocked the content, it won’t appear. Google the URL; if it shows up, searchers can find it.
Open the Index coverage card to learn more about the URL’s presence on Google, including which sitemaps point to this URL, the referring page that led Googlebot to this URL, the last time Googlebot crawled this URL, whether you’ve allowed Googlebot to crawl this URL, whether Googlebot actually could fetch this URL, whether this page disallows indexing, the canonical URL you’ve set for this page, and the URL Google has selected as the canonical for this page.
The Enhancements section gives you information on:
- The AMP version of this page, if it exists, and any AMP-specific issues
- Status for job posting and/or recipe structured data
25. Use the Reg-Ex Filter.
Bianca “Binks” Anderson, HubSpot SEO Strategist, recommends using the reg-ex filter. In GSC, the “regex filter” refers to using regular expressions (regex) to filter the data in the Performance or Search Analytics report based on specific patterns or criteria.
“When setting up a regex filter in GSC, you can specify a regular expression pattern to include or exclude certain URLs or queries from your reports. This can be helpful for segmenting the data based on specific URL structures, query patterns, or other criteria,” she says.
Do you want to analyze the performance of a specific group of URLs? With the help of regular expressions (reg-ex), you can filter your Google Search Console (GSC) data to only display the metrics for the URLs you are interested in. A useful tool for this is the URL Regex Generator, a free Google Chrome extension that allows you to easily generate a regex pattern for your desired set of URLs. Simply copy and paste the URLs into the tool, and it will create the corresponding regex for you.
25. Use the date compare feature.
According to Amanda Sellers, HubSpot Blog Strategy Manager, the date compare feature is “a great way to keep tabs on search performance and whether you’re trending up or down in certain areas.”
Take the Next Steps to Learn More
HubSpot’s CMS Hub Pro and Enterprise offer integration with Google Search Console, providing you with enhanced control and insights into your website’s performance in organic search.
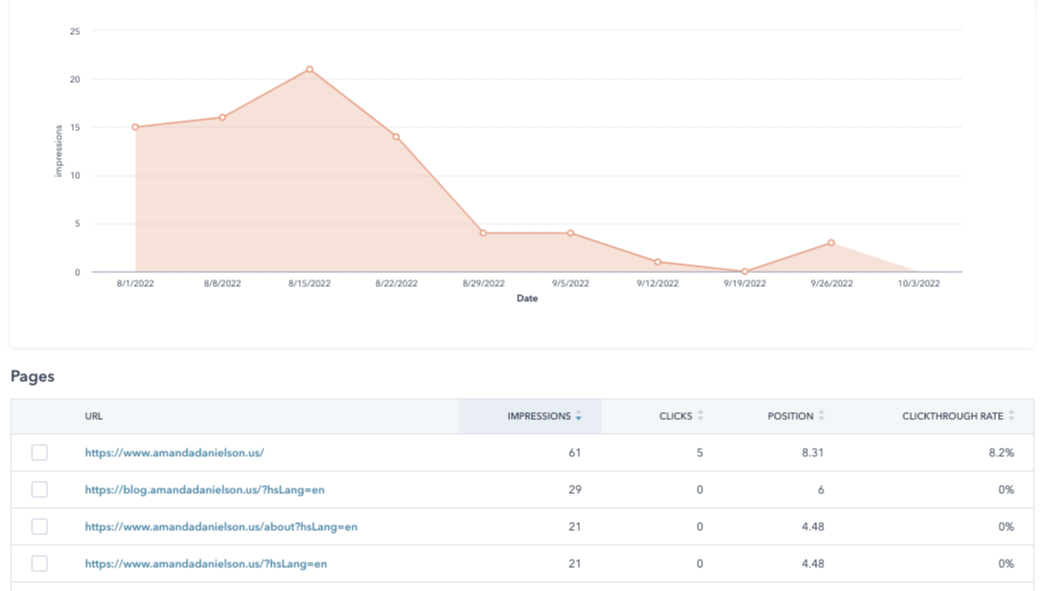
Get started with Google Search Console Integration with HubSpot’s tools
You can gain access to valuable data such as search queries, impressions, clicks, and average position of their website in Google Search results. This integration enables you to identify opportunities for increasing organic traffic, optimize content to target specific keywords, and track the impact of their SEO efforts.
Editor’s note: This post was originally published in October 2018 and has been updated for comprehensiveness.
![→ Download Now: SEO Starter Pack [Free Kit]](https://no-cache.hubspot.com/cta/default/53/1d7211ac-7b1b-4405-b940-54b8acedb26e.png)


